How to Measure and Improve Cost Schedule Performance in Construction
In construction, staying on time and on budget isn’t a bonus—it’s the baseline. But with project delays and cost overruns more common than not, how do you actually measure performance?
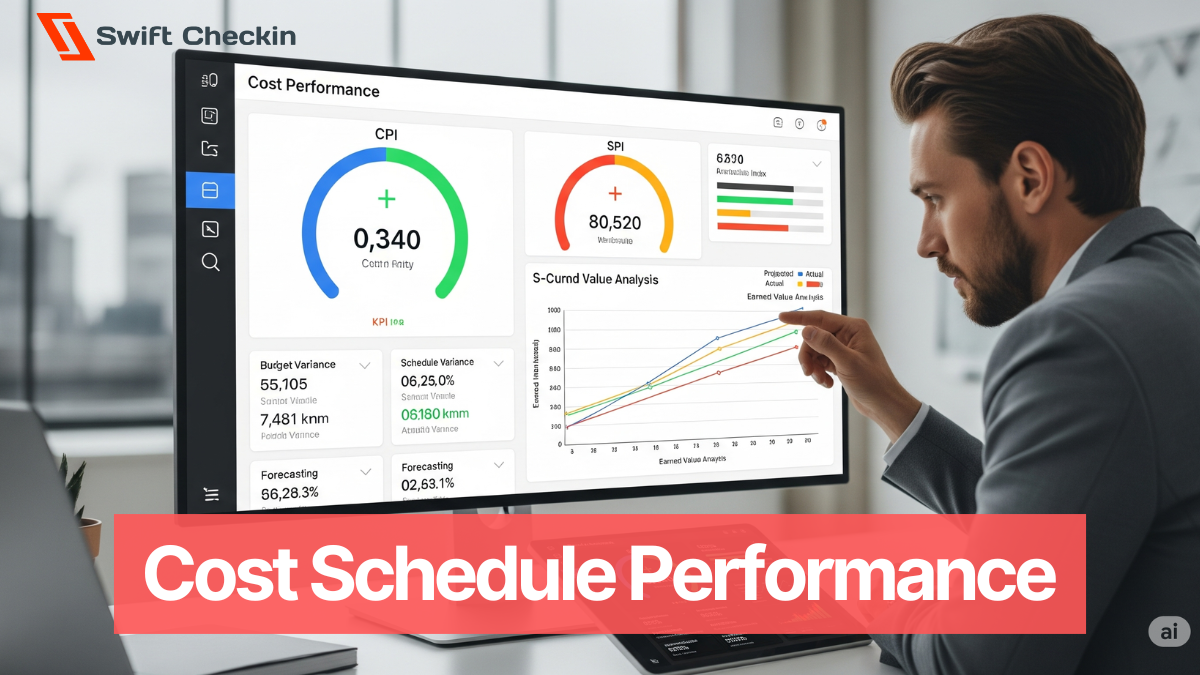
The answer: Cost Schedule Performance—a set of simple but powerful metrics that give you visibility into how your project is really doing.
Understanding cost schedule performance helps you stay proactive. This guide breaks down what it means, how to measure it, and how contractors are using it to finish stronger in 2025.
What Is Cost Schedule Performance in Construction?
Cost schedule performance refers to how well a construction project is tracking against its original budget (cost) and timeline (schedule).
When measured correctly, it helps answer key questions like:
- Are we ahead or behind schedule?
- Are we over or under budget?
- Are we getting the value we expected for the work completed so far?
The industry uses a system called Earned Value Management (EVM) to track these metrics. But don’t let the term scare you.
The 3 Metrics That Matter
1. Planned Value (PV)
Also known as Budgeted Cost of Work Scheduled.
What it is: The value of work you planned to have done by a certain date.
Example: If you planned to complete 30% of a project by Week 4, and the total budget is $500K, your PV is $150K.
2. Earned Value (EV)
Also known as Budgeted Cost of Work Performed.
What it is: The value of work you’ve actually completed by that date.
Example: For the same context as above, if you've completed 25% of the work at week 4 your EV is $125K.
3. Actual Cost (AC)
Also called Actual Cost of Work Performed.
What it is: The real cost you’ve incurred to date.
Example: If you've spent $140K to get that 25% done, your AC is $140K.
How to Calculate Cost Schedule Performance
With the above numbers, you can now calculate two essential performance indicators:
Schedule Performance Index (SPI)
Formula:
SPI = Earned Value (EV) ÷ Planned Value (PV)
Tells you: Are you ahead or behind schedule?
- SPI > 1 = ahead of schedule
- SPI < 1 = behind schedule
Cost Performance Index (CPI)
Formula:
CPI = Earned Value (EV) ÷ Actual Cost (AC)
Tells you: Are you under or over budget?
- CPI > 1 = under budget
- CPI < 1 = over budget
Example
Let’s say:
- Planned Value = $200K
- Earned Value = $180K
- Actual Cost = $220K
SPI = 180K / 200K = 0.90 (You’re behind schedule)
CPI = 180K / 220K = 0.82 (You’re over budget)
Now you’ve got data you can act on—not just gut feeling.
Why Cost Schedule Performance Matters
Visibility Early in the Project
You can spot problems before they become costly. If SPI or CPI drop below 1.0 early on, you can pivot fast.
Better Forecasting
Performance trends help you project the final cost and completion date more accurately in addition to tracking hours or expenses.
Data-Driven Decisions
You exactly know the deviation in budget and schedule by how much and where. That helps you decide if you need to add labor, renegotiate subs, or adjust scope.
How to Improve Cost Schedule Performance
1. Use a Cost-Loaded Schedule
Don’t separate the budget from the schedule. A cost-loaded schedule links time and cost together, so you know exactly how much you're spending and when.
It helps you plan cash flow, forecast earned value, and track performance—all in one view.
Read: What Is a Cost-Loaded Construction Schedule?
2. Track Progress Consistently
Weekly updates are ideal. Whatever tools (field reports, digital timesheets, subcontractor check-ins) you use, make sure progress is recorded and tied to your planned value.
This ensures your SPI and CPI reflect what’s really happening on-site.
3. Break Down Work into Manageable Units
Cost schedule performance works best when your WBS (Work Breakdown Structure) is clean and clear. Smaller tasks mean more accurate data and better control.
Don’t track performance by phase. Track it by activity.
4. Align Your Team
Make sure field supervisors, PMs, and back-office teams all understand the numbers. You don’t need to explain EVM formulas—but everyone should know what “falling behind” means and what action to take.
5. Use the Right Tools
Manual tracking leads to delays and data gaps. Use a platform that combines scheduling, cost tracking, and field updates in one place. That way, SPI and CPI are served in real-time.
Common Mistakes to Avoid
- Tracking cost and schedule separately
This leads to blind spots and finger-pointing. - Skipping updates for a week (or two)
If your performance data lags, your decisions will too. - Overcomplicating the system
Keep calculations simple, and automate where possible.
The Bottom Line
More than a metric for tracking, Cost schedule performance is a mindset. It gives you a smarter way to manage construction projects by connecting the schedule to the money you’re spending.
In an industry where overruns are the norm, SPI and CPI can give your team the edge. It’s like driving with a GPS—you always know exactly where you are on the map and can reroute instantly if there’s a roadblock.
Tools like Swift Checkin give real-time visibility into cost and schedule performance. So you can spot issues early and improve project outcomes with less admin.